What the Calculator Tracks
Transportation
Log trips by mode: car (with fuel type and efficiency), public transit, flights (short-haul, medium-haul, long-haul), and cycling/walking. The system uses distance-based emission factors from the UK DEFRA database and EPA guidelines. For flights, it accounts for radiative forcing (the high-altitude warming effect that makes aviation emissions 2-4x worse than ground-level CO2).
Energy
Enter electricity consumption (kWh from utility bills) and the system applies location-specific grid emission factors. A kWh in France (nuclear-heavy grid) produces 5x less CO2 than a kWh in Poland (coal-heavy grid). Natural gas, heating oil, and renewable energy sources are tracked separately. The system supports Scope 2 reporting with both location-based and market-based methods.
Diet and Consumption
Track food consumption by category (red meat, poultry, dairy, vegetables, grains) using per-serving emission factors. The calculator shows the carbon impact of dietary choices -- switching from beef to chicken cuts meal emissions by 75%. Purchasing emissions (clothing, electronics, furniture) use economic input-output factors from the EXIOBASE database.
Dashboard and Reporting
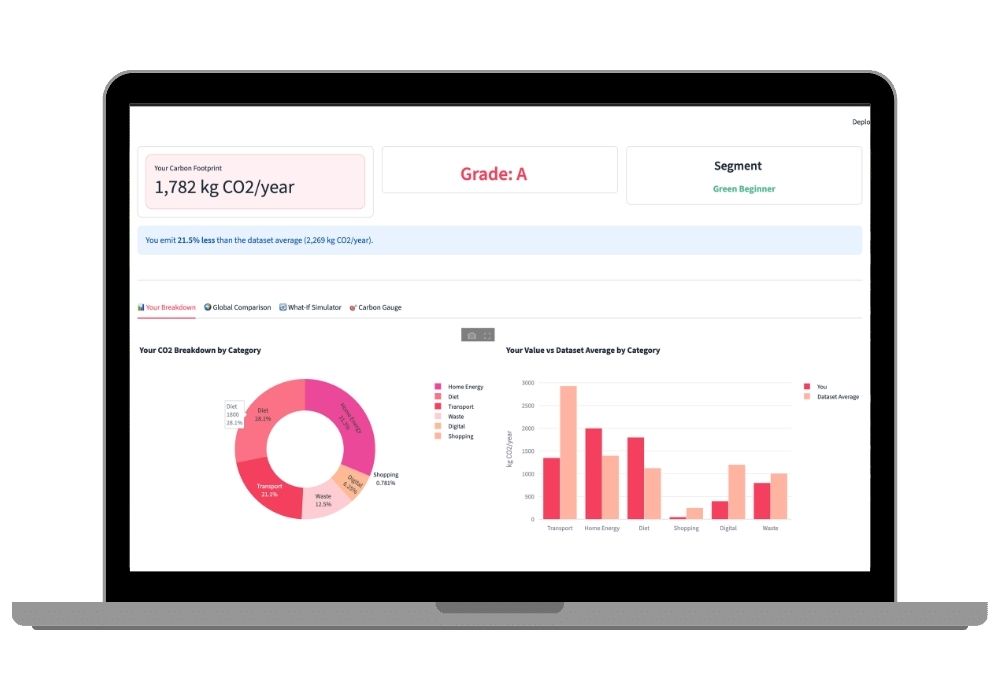
The dashboard shows total emissions by category (pie chart), monthly trends (line chart), comparison to national averages, and progress toward reduction goals. For corporate users, emissions are categorized into Scope 1 (direct), Scope 2 (electricity), and Scope 3 (supply chain) per GHG Protocol standards. Reports export as PDF with methodology notes for audit compliance.