AI Carbon Footprint Calculator - Predict Your CO2 Emissions Using Machine Learning
A machine learning-powered carbon footprint calculator built with Python and Streamlit that predicts your annual CO2 emissions based on lifestyle inputs.
Technology Used
Python | Streamlit | Pandas | NumPy | Scikit-learn | XGBoost | Plotly | Matplotlib | Seaborn | FPDF2 | Joblib | Jupyter Notebook

Project Files
Personal Carbon Footprint Prediction Using Machine Learning
Most people have no real idea how much carbon dioxide their daily habits produce. They might know that driving pollutes more than cycling, but when it comes to putting a number on their grocery shopping, shower frequency, or screen time, things get vague fast. This project changes that. It takes roughly 20 lifestyle inputs from a user, runs them through a trained machine learning model, and returns a concrete annual CO2 estimate in kilograms, along with a full breakdown of where that carbon is actually coming from.
Machine Learning Model and Dataset
The prediction engine sits on two algorithms: Random Forest and XGBoost. Both were trained on the Individual Carbon Footprint Calculation dataset from Kaggle, which includes thousands of records covering body type, diet, transport habits, energy sources, waste generation, digital usage, and more.
The raw dataset needed cleanup before it was usable. Columns like Recycling and Cooking_With stored Python list strings that had to be parsed and one-hot encoded. Vehicle Type had blanks for people who walk or take public transport, which required explicit handling. The complete preprocessing, feature engineering, model training, and evaluation pipeline is available inside a Jupyter Notebook so students can understand every step of the workflow.
Streamlit Dashboard
After training, the models are exported as pickle files and loaded into a Streamlit web application. The application contains five organized input sections:
- Personal: Body type, gender, and diet.
- Home: Shower habits, heating source, cooking methods, and energy efficiency.
- Transport: Transportation mode, vehicle type, and monthly travel distance.
- Lifestyle: Social activity, grocery spending, clothing purchases, and air travel.
- Digital & Waste: Screen time, internet usage, waste generation, and recycling habits.
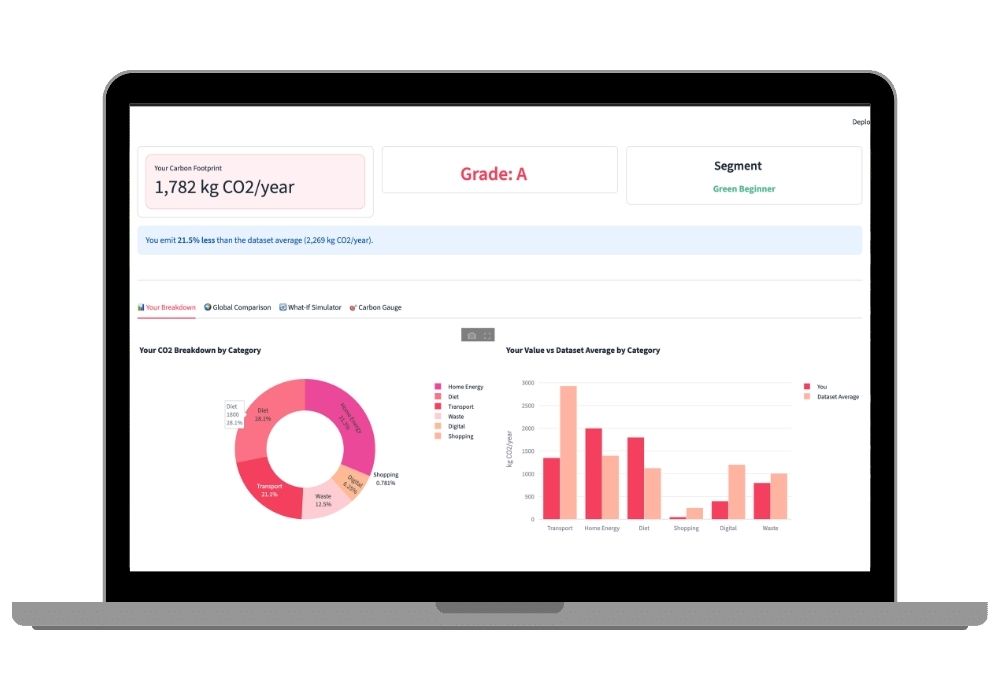
Once the user submits the form, the application predicts the annual carbon footprint, assigns an environmental grade from A to F, categorizes the user using KMeans clustering into groups such as Eco Warrior, Green Beginner, Average Consumer, or High Emitter, and compares the result with the dataset average.
Interactive Analytics Dashboard
Carbon Emission Breakdown
The first dashboard tab displays a Plotly donut chart that separates emissions into transport, home energy, diet, shopping, digital usage, and waste, making it easy to identify the largest contributors.
Country Comparison
The second tab compares the predicted footprint with average emissions from India, the USA, the UK, China, Germany, Brazil, Japan, and the global average, allowing users to benchmark their lifestyle.
What-If Lifestyle Simulator
The third tab lets users simulate lifestyle changes such as switching to a vegetarian diet, reducing flights, or using public transport. The dashboard instantly recalculates the estimated annual carbon savings.
Carbon Gauge Meter
The final dashboard tab includes a color-coded gauge chart that places the user's emissions on a 0–20,000 kg CO₂ scale using green, yellow, orange, and red zones for quick interpretation.
Recommendation and Carbon Offset Engine
Personalized Recommendations
The recommendation engine analyzes user inputs and provides a prioritized list of actionable improvements. Every recommendation includes an estimated annual CO₂ reduction, helping users understand the environmental impact of each change.
Carbon Offset Calculator
The project converts total emissions into real-world equivalents such as:
- Number of trees required to offset emissions.
- Equivalent solar panels needed.
- Estimated car-free days required to compensate for the footprint.
PDF Report Generation
Using FPDF2, the application generates a professional PDF report containing the user's predicted emissions, environmental grade, complete input summary, emission breakdown, personalized recommendations, estimated savings, and carbon offset calculations. This report can be submitted as part of academic documentation or project demonstrations.
Project Features
Core Features
- Machine learning prediction using Random Forest and XGBoost.
- Model evaluation using R² score and performance metrics.
- Comprehensive feature engineering.
- KMeans clustering for user segmentation.
- Interactive Plotly dashboard with multiple visualizations.
- What-if lifestyle simulation.
- Rule-based recommendation engine.
- Carbon offset calculator.
- Professional PDF report generation.
- Responsive Streamlit interface with custom styling.
Who Should Build This Project?
Ideal for Final Year Students
This project is suitable for BCA, MCA, BTech CSE, and BSc IT students looking for a final year project. It combines supervised learning, unsupervised learning, feature engineering, web application development, and report generation into a single end-to-end solution.
Perfect AI and Machine Learning Project
If you are searching for AI and ML project ideas, this project demonstrates practical machine learning while addressing an important real-world environmental problem. The complete solution runs locally using open-source technologies without requiring paid APIs or cloud services.
Real-World Applications
Educational and Industry Use Cases
The project can be adapted for multiple domains including:
- Corporate sustainability and employee carbon audits.
- Universities and schools for environmental awareness programs.
- NGOs promoting climate education.
- Government carbon reduction campaigns.
- Individuals monitoring and reducing their annual carbon footprint.
Technology Stack
Libraries and Frameworks Used
The project is built using Python, Pandas, NumPy, Scikit-learn, XGBoost, Plotly, Matplotlib, Seaborn, Streamlit, FPDF2, Joblib, and Jupyter Notebook. Scikit-learn handles Random Forest, KMeans clustering, preprocessing, scaling, and encoding, while Plotly powers the interactive visualizations and Streamlit provides the user interface.
Project Setup and Mentorship
Setup Assistance
Need help getting the project running on your machine? CodeAj offers project setup sessions where we install dependencies, configure the environment, and walk you through the complete codebase over a live screen-sharing session.
Complete Project Mentorship
We also provide complete mentorship covering installation, documentation, viva preparation, presentation guidance, and debugging support throughout your project journey.
Research Paper Support
If your college requires a publication, explore our research paper writing service for IEEE and IJERT formatted papers.
Explore More Projects
Browse Similar Projects
Browse more Python and machine learning projects on the CodeAj Marketplace. You can also explore dedicated categories including Web Development Projects and Computer Vision Projects to find projects that match your academic requirements.
Extra Add-Ons Available – Elevate Your Project
Add any of these professional upgrades to save time and impress your evaluators.
Project Setup
We'll install and configure the project on your PC via remote session (Google Meet, Zoom, or AnyDesk).
Source Code Explanation
1-hour live session to explain logic, flow, database design, and key features.
Want to know exactly how the setup works? Review our detailed step-by-step process before scheduling your session.
₹999
Custom Documents (College-Tailored)
- Custom Project Report: ₹1,500
- Custom Research Paper: ₹1,000
- Custom PPT: ₹800
Fully customized to match your college format, guidelines, and submission standards.
Project Modification
Need feature changes, UI updates, or new features added?
Charges vary based on complexity.
We'll review your request and provide a clear quote before starting work.