EduPredict Pro Student Performance Prediction System with 4 Portals | ML Final Year Project
A Flask + React academic analytics platform that predicts student marks using a Random Forest model trained on 10,000 records with separate logins for admin, faculty, students, and parents. Full source code included.
Technology Used
React 18 | Flask | scikit-learn | SQLite


What This Project Actually Does
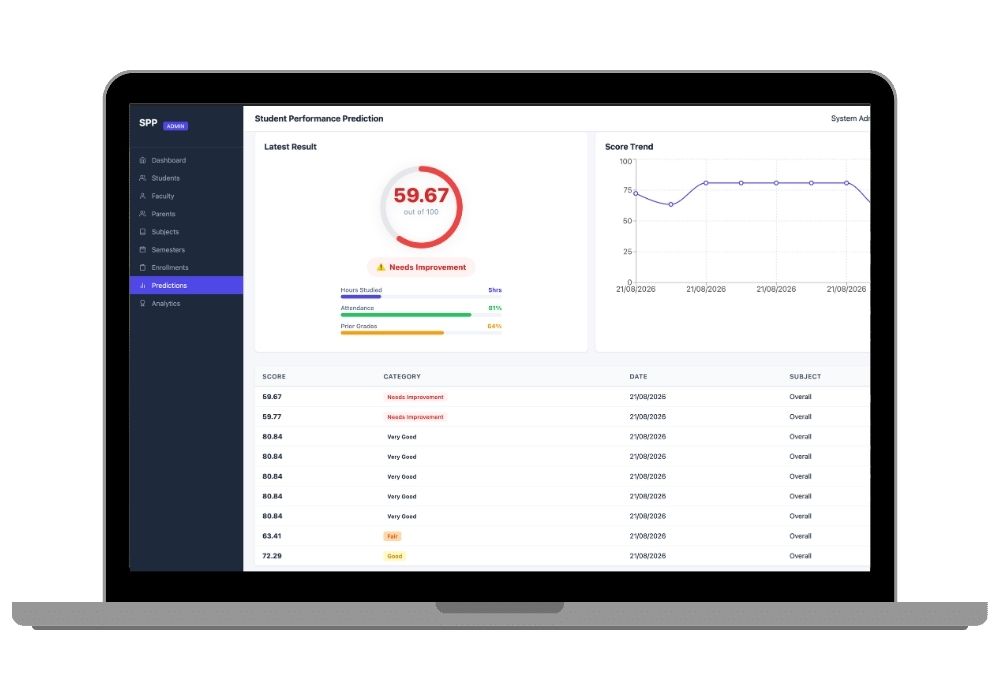
EduPredict Pro takes three things a college already tracks — how many hours a student studies, their attendance percentage, and their previous semester grades — and predicts what they're likely to score next. That's it. No magic, no buzzwords. A Random Forest model chews on those numbers and spits out a score plus a category like "Very Good" or "Needs Improvement."
But the prediction is only half of it. The bigger part is the four separate portals sitting on top. An admin logs in and sees the whole college. A faculty member logs in and sees only their own students. A student sees their own marks and attendance. A parent sees their kid's progress. Same backend, four completely different experiences, all controlled by JWT role-based access.
Honestly, this is the kind of project that looks like a team of four built it over six months. It didn't. But your examiner doesn't need to know that.
Key Features
- Random Forest prediction engine — 100 trees, max_depth of 15, trained on a 10,000-row dataset. R² comes out to 0.807 with an MAE of 4.25, which is genuinely defendable in a viva. Feature importance breaks down as Hours Studied 53%, Prior Grades 28%, Attendance 18%.
- Four working portals, not four hardcoded pages — Admin, Faculty, Student, and Parent dashboards, each hitting different API routes under
/api/admin/,/api/faculty/,/api/student/, and/api/parent/. - Admin dashboard with 7+ live charts — attendance trends, department-wise splits, marks distribution, prediction spread, and a student ranking board. All Recharts, all fed by real data from the database.
- Bulk attendance in one shot — a faculty member can mark an entire class present or absent for a date without clicking through 40 students one by one.
- Four types of marks entry — internal, assignment, midterm, and final are stored separately, so the prediction feature actually has something meaningful to compute from.
- Faculty remarks with read tracking — appreciation, warning, or suggestion. The system records whether the student actually opened it. Small feature, but examiners love it because it shows you thought about workflow, not just CRUD.
- 12-table relational schema — users, students, faculty, parents, subjects, semesters, enrollments, faculty_students, attendance_records, marks, predictions, remarks. Proper foreign keys, unique constraints on enrollment, the works.
- Ready demo accounts — seeded on first run.
admin@spp.com/admin123and three more, so you can screen-record every portal within minutes of setup.
How the Prediction Actually Works
This is the section your guide will ask about, so read it twice.
The training script lives at backend/ml/train_model.py. It reads data/student_performance.csv, scales the three input features using a StandardScaler, and fits a RandomForestRegressor from scikit-learn. Two files get written out: rf_model.pkl and scaler.pkl.
At runtime, backend/services/prediction_service.py doesn't ask anyone to type in numbers. It computes them. Attendance percentage gets calculated from the actual attendance_records table. Prior grades come from the marks table. Hours studied is the one input a faculty member provides. Those three go through the scaler, then the model, and the result lands in the predictions table along with a JSON snapshot of the inputs used — so you have an audit trail.
Then it buckets the number: 90 and above is Excellent, 80 to 89 Very Good, 70 to 79 Good, 60 to 69 Fair, below 60 is Needs Improvement. The student portal reads that bucket and shows tailored recommendations.
The hard part, and the easy part
The hard part: understanding why R² = 0.807 is a reasonable result and not a failure. Some examiners will poke at this. The honest answer is that student performance has real randomness in it, three features can't capture everything, and a model explaining roughly 80% of the variance on 10K rows is solid. Have that answer ready.
The easy part: everything else. The frontend is plain JSX with Vite, no TypeScript, no Redux, no build config you'll need to fight with. Run npm install, run npm run dev, it opens on port 5173 and just works.
Real-World Applications
- Colleges running early-warning systems — flagging students heading toward a backlog before the semester ends, not after results are out.
- Coaching institutes that need to show parents concrete progress data instead of vague "he's doing okay" phone calls.
- School ERP vendors who want a prediction module bolted onto an existing attendance and marks system.
- University mentoring programs where each faculty member is assigned a set of students and needs one screen showing who's slipping.
- NAAC and accreditation documentation, where institutions have to demonstrate data-driven student support processes.
Who Should Buy This
If you're a student who needs a working project for your college submission, final-year project, semester project, internship, or academic demonstration, this is for you. Whether you're studying BCA, B.Tech, MCA, M.Tech, Computer Science, IT, AI, Data Science, or another related field, you can choose a project that fits your requirements. If you need the source code, project report, documentation, or help setting up and running the project, CodeAj gives you the resources and support to get started faster.
Specifically though — this one suits you if your syllabus expects both a machine learning component and a full-stack application. A lot of AI final year projects are just a Jupyter notebook with a confusion matrix at the end. That gets marks, but not great marks. This has an actual trained model wired into an actual multi-user web application, which is a different conversation entirely.
Why CodeAj
You get the complete codebase — every Flask blueprint, all 12 SQLAlchemy models, the React pages for all four portals, the training script, the CSV dataset, and the Alembic migrations. Not a demo build. The real thing. A project report is available alongside it covering the abstract, literature survey, system design, ER diagram, module descriptions, and testing, formatted the way most Indian universities want it. And if the setup breaks on your machine — wrong Python version, npm throwing errors, database not seeding — we'll help you get it running instead of leaving you on your own two nights before submission. Browse more machine learning projects with source code or the wider Flask projects collection if you want to compare before deciding.
Frequently Asked Questions
Extra Add-Ons Available – Elevate Your Project
Add any of these professional upgrades to save time and impress your evaluators.
Live 1-on-1 Mentorship
Personal session with an expert developer
Project Setup
We'll install and configure the project on your PC via remote session (Google Meet, Zoom, or AnyDesk).
Source Code Explanation
1-hour live session to explain logic, flow, database design, and key features.
Want to know exactly how the setup works? Review our detailed step-by-step process before scheduling your session.
₹999
Custom Documents (College-Tailored)
- Custom Project Report: ₹1,500
- Custom Research Paper: ₹1,000
- Custom PPT: ₹800
Fully customized to match your college format, guidelines, and submission standards.
Project Modification
Need feature changes, UI updates, or new features added?
Charges vary based on complexity.
We'll review your request and provide a clear quote before starting work.