Netflix Content Analytics Dashboard — Python Final Year Project with Source Code and ML Genre Classifier
Turn the public Netflix catalog into a live analytics dashboard — 8 Chart.js visualizations, a pandas cleaning pipeline, and a TF-IDF genre classifier. Runs on your laptop in 10 minutes.
Technology Used
Python | Flask | pandas | scikit-learn | Chart.js | Jupyter Notebook

What This Project Actually Does
You take the public Netflix titles catalog — around 8,800 rows of movies and TV shows sitting in a CSV — and you turn it into a dashboard that actually answers questions. How much of the catalog is movies versus shows? Which countries produce the most content? Which directors show up again and again? What happened to release volume after 2016?
The data gets cleaned once, offline, inside a Jupyter notebook. That notebook fills in missing directors and cast members, fixes a genuinely annoying column-shift bug that exists in the raw dataset, parses date_added into real datetime objects, and pulls duration_minutes out of movie rows and seasons out of TV rows using regex. Output is a clean CSV.
Then app.py — a Flask app, nothing fancy — loads that cleaned CSV, computes the aggregates with pandas, and hands them to a single-page dashboard rendered with Chart.js. Two routes. That's the entire backend.
And there's a bonus ML layer on top. A TF-IDF vectorizer over the description column, a MultiLabelBinarizer for the genre tags, and a OneVsRestClassifier wrapping logistic regression. Feed it a plot summary, it predicts the genres. Model artifacts get saved with joblib so you never have to retrain during your viva.
Key Features
The dashboard itself
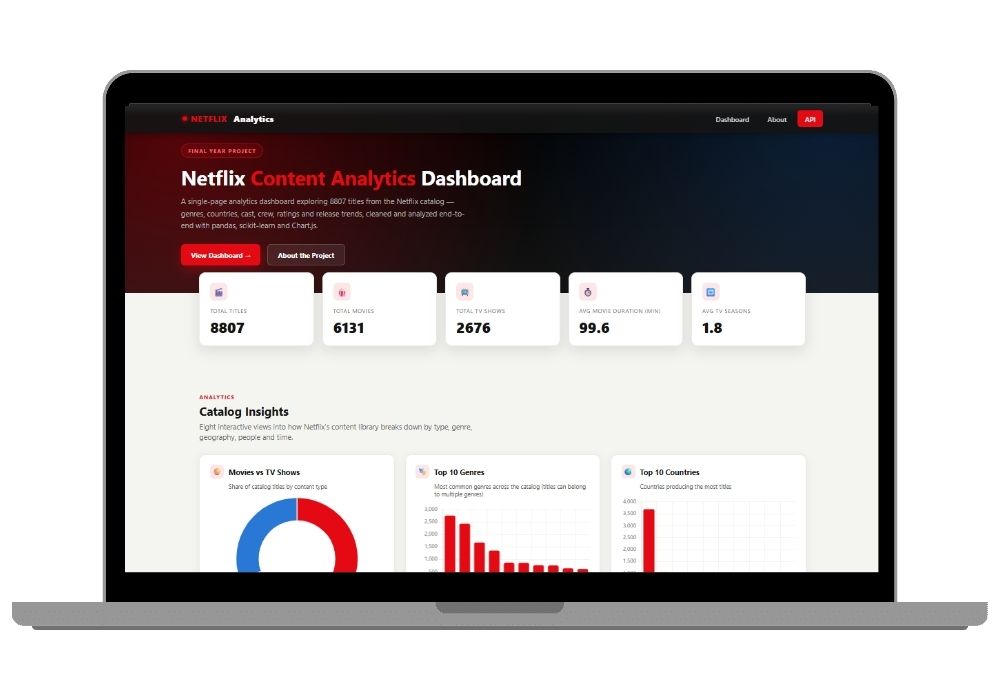
- Eight interactive charts: Movies vs TV Shows (doughnut), Top 10 Genres, Top 10 Countries, Release Year Trend, Rating Distribution, Titles Added Per Month, Top 10 Directors, and Top 10 Actors — the last two as horizontal bars because vertical labels are unreadable at that length
- Five summary cards across the top: Total Titles, Total Movies, Total TV Shows, Average Movie Duration in minutes, Average Seasons per show
- Dark header styling that looks intentional, not like a Bootstrap default someone forgot to change
The data layer
- Missing-value handling for director, cast, country and rating — no dropped rows, no silent NaNs breaking your groupby
- The shifted-column repair. Some rows in the raw file have their fields off by one position, which quietly poisons every count you compute. Notebook catches and fixes it.
- Regex-based duration parsing that handles both "94 min" and "2 Seasons" formats in the same column
The ML piece
- Multi-label genre prediction from description text, with
vectorizer.pkl,mlb.pklandgenre_model.pklsaved and committed - Full training walkthrough in the notebook so you can explain every step when your examiner asks how the model learned
The API
GET /renders the dashboard fromtemplates/index.htmlGET /api/summaryreturns the exact same metrics as JSON — useful if you want to extend this into a mobile app later, or just to prove to your guide that the backend and frontend are actually separated
One more thing that saves you: if processed/cleaned.csv is missing for any reason, app.py runs the same cleaning logic in memory at startup. The app never refuses to boot. Small detail, big relief at 11 PM before submission.
Real-World Applications
OTT platforms run exactly this kind of catalog analysis before deciding what to license next — which regions are underrepresented, which genres are saturated, whether the acquisition team has been buying too many 2019 titles. Media research firms build similar dashboards for competitive reporting.
Outside streaming, the same pattern applies anywhere you have a messy product catalog and questions about it. Library systems. E-commerce inventory. Music archives. Swap the CSV, change the column names, and the architecture holds.
For your own portfolio, this reads as a data engineering plus visualization project rather than another CRUD app. Recruiters looking at fresher resumes see a lot of student management systems. They see far fewer projects where someone cleaned real dirty data and explained why.
Who Should Buy This
If you're a BCA or BSc IT student in your final semester, your synopsis is already approved, and you now need working code plus a report in under two weeks — this fits. It's a Python project, so it maps to almost every university's syllabus, and it doesn't need a database server, a paid API, or a cloud account.
MCA and BTech CSE students who want something with an actual ML component but don't want to fight with deep learning setup — this is your middle ground. Scikit-learn only. No CUDA, no GPU, no 4 GB model downloads.
Honestly, if your guide has specifically asked for a deep learning project with a neural network, this isn't the one. Logistic regression is classical ML and you'd be misrepresenting it. Check first.
Now, the hard part — because you should know before you buy. The genre classifier is multi-label, and multi-label accuracy scores look bad. Like, 30-something percent bad, because a prediction only counts as correct if it gets every genre tag right. Your examiner may look at that number and frown. You need to be ready to explain subset accuracy versus Hamming loss versus per-label F1. The notebook walks through this, but it's the one thing you genuinely have to understand rather than just run.
The easy part? Setup. There's no database to configure, no environment variables, no API keys. It's a virtualenv, a pip install, and python app.py. If you've ever run a Flask hello-world, you're already qualified.
Why CodeAj
Every project ships with a complete project report — abstract, literature survey, system design with diagrams, module descriptions, testing tables, conclusion, references — formatted the way Indian universities actually want it, not a generic template. You also get the cleaned dataset and pre-trained model files committed in the repo, so nothing depends on you successfully re-running a notebook the night before. And if the app doesn't start on your machine, our project setup support gets on a call and fixes it with you. We'd rather spend twenty minutes on a screen share than have you submit something broken.
If data-heavy work is your thing, browse the rest of our data science projects with source code — several use the same pandas-plus-Flask pattern, so a second project becomes much faster to understand. Students specifically looking for Python final year projects will find the whole collection sorted by difficulty there.
Frequently Asked Questions
Extra Add-Ons Available – Elevate Your Project
Add any of these professional upgrades to save time and impress your evaluators.
Live 1-on-1 Mentorship
Personal session with an expert developer
Project Setup
We'll install and configure the project on your PC via remote session (Google Meet, Zoom, or AnyDesk).
Source Code Explanation
1-hour live session to explain logic, flow, database design, and key features.
Want to know exactly how the setup works? Review our detailed step-by-step process before scheduling your session.
₹999
Custom Documents (College-Tailored)
- Custom Project Report: ₹1,500
- Custom Research Paper: ₹1,000
- Custom PPT: ₹800
Fully customized to match your college format, guidelines, and submission standards.
Project Modification
Need feature changes, UI updates, or new features added?
Charges vary based on complexity.
We'll review your request and provide a clear quote before starting work.