Mumbai AQI Prediction System — Real-Time Air Quality Forecasting Using XGBoost and Live Weather Data
A full-stack Django web application that predicts Air Quality Index for four Mumbai stations using XGBoost ML model and live meteorological data from the Windy API.
Technology Used
Python | Django | XGBoost | scikit-learn | Windy Point Forecast API | Plotly.js | Bootstrap 5 | SQLite | Jupyter Notebook | pandas | numpy | joblib

Project Files
Mumbai AQI Prediction System
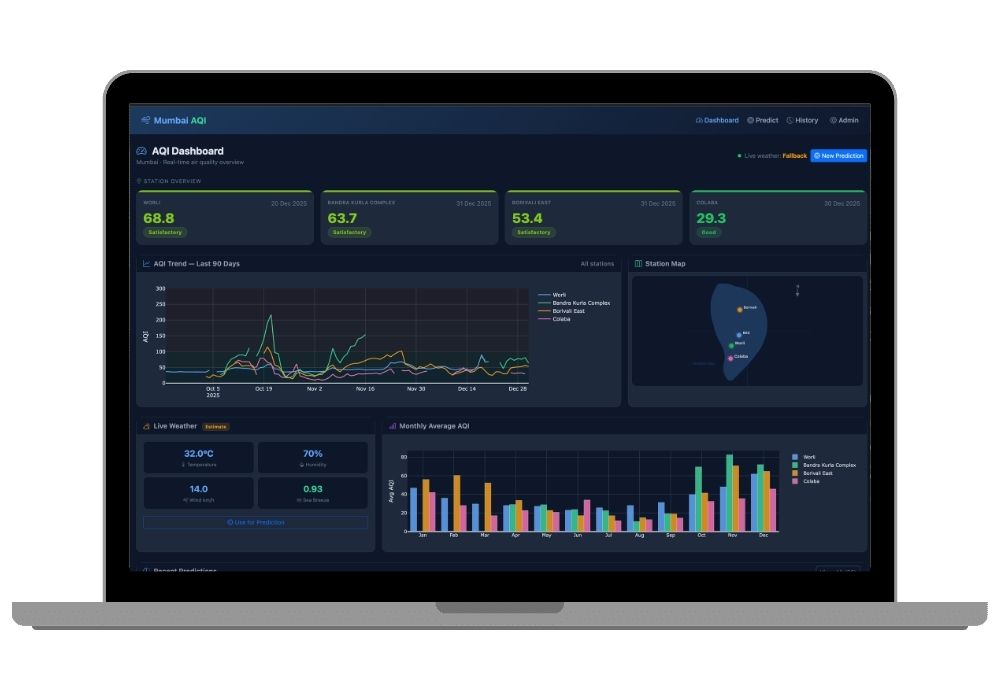
Air pollution is one of the most measurable and data-rich environmental problems we have today, and yet most people have no practical way to anticipate what the air around them will be like tomorrow. This project changes that for Mumbai. The Mumbai AQI Prediction System is a full-stack machine learning web application that uses live meteorological data and a trained XGBoost model to forecast the Air Quality Index for four monitoring stations across the city — Worli, Bandra Kurla Complex, Borivali East, and Colaba.
The project is available for purchase at CodeAj Marketplace with complete source code, a pre-built college-format project report, and optional setup support. It is one of the strongest Python final year projects in the AI and Data Science category because it connects a trained model directly to real-world live weather data — meaning the predictions are not just historical replays, they are actual forecasts.
What This Project Does
The system pulls current weather readings from the Windy Point Forecast API — wind speed, temperature, humidity, and sea-breeze data — and feeds them into a trained XGBoost regression model alongside time-lagged AQI features. The model was trained on three years of merged Mumbai AQI and meteorological data, achieving a Mean Absolute Error of 9.25 and an R-squared of 0.731. That puts it solidly within practical prediction range for an academic or portfolio-grade project.
The frontend is a Bootstrap 5 dark-theme dashboard with Plotly.js charts showing 90-day AQI trends and monthly averages. Users can get an instant prediction with one click using live weather, or manually override individual parameters. Every prediction gets logged to a filterable history table with color-coded AQI categories based on the India CPCB scale.
Key Features
- Live weather ingestion via Windy API — the application automatically fetches wind speed, temperature, humidity, gust data, and sea-breeze index from the GFS model for whichever Mumbai station the user selects. No manual data entry needed for real-time predictions.
- XGBoost ML model with 13 engineered features — the model uses AQI lag features (1-day, 3-day, 7-day), rolling averages, wind and humidity readings, seasonal encoding, and station encoding. Compared against a Random Forest baseline (MAE 11.43, R² 0.657), XGBoost came out ahead on every metric.
- Interactive Plotly.js dashboard — a 90-day AQI trend chart, monthly average bars, and live weather tiles all load on the main dashboard without any page reload.
- AJAX prediction form with manual override — users can fetch live weather with one button click and then adjust individual parameters before predicting. A sea-breeze indicator lights up when coastal wind conditions are active.
- Prediction history log — every prediction is stored in the database and displayed in a filterable, color-coded table. Useful for tracking how predictions change across different weather conditions.
-
REST API endpoint — the
POST /api/predict/endpoint accepts JSON and returns predictions programmatically, making it easy to connect a mobile app or external service to the model. - Full Jupyter notebook for model training — the project includes the complete data analysis and model training notebook so students can understand and explain every step of the ML pipeline during their viva.
Real-World Applications
Beyond the academic context, systems like this have direct practical use. Municipal corporations and environmental agencies use AQI forecasting to plan high-emission restriction days and public health advisories. Hospitals use air quality data to anticipate spikes in respiratory admissions. Schools and event organizers use it to decide whether outdoor activities are safe.
For students, this project demonstrates several career-relevant skills in one build: data engineering (merging multi-source CSVs), feature engineering (lag features, rolling means, seasonal encoding), ML model selection and evaluation, REST API design in Django, and production-grade frontend development. It is a strong addition to any portfolio targeting data analyst, ML engineer, or backend developer roles.
The project is also well-suited for extension. Students who want to go further can add a Celery-based scheduler for automated daily predictions, a notification system for poor/severe AQI alerts, or a Flutter mobile interface using the existing REST API. If you need help scoping any of these additions, the team at CodeAj offers custom development and mentorship services.
ML Model and Data Details
The training dataset covers three years of daily AQI readings merged with meteorological records for the four Mumbai stations. The 13 input features include time-series lag values (AQI from 1, 3, and 7 days prior), a 7-day and 30-day rolling mean, wind speed, humidity, temperature, a computed sea-breeze strength feature (sea_breeze_index multiplied by wind_speed), day of year, month, season encoding (Winter=0, Summer=1, Monsoon=2, Post-monsoon=3), and station encoding.
The sea-breeze feature is worth noting specifically. Mumbai's coastal geography means onshore winds during summer afternoons regularly flush out pollutants that would otherwise accumulate over the city. Encoding this as a feature — rather than treating wind speed alone — materially improved model accuracy, particularly for Worli and Colaba which sit directly on the coastline.
Model artifacts (best_aqi_model.pkl, scaler.pkl, feature_columns.pkl) are saved with joblib and loaded at Django startup via ml_utils.py. The scaler is applied at prediction time to match the normalization used during training.
What You Get When You Buy
Purchasing this project from CodeAj Marketplace gives you the complete Django project folder, the Jupyter training notebook, the merged CSV datasets, trained model pkl files, a pre-built college-format project report, and access to our setup walkthrough session. The project is ready to run locally within minutes of download.
For students who need more help, CodeAj also offers a source code explanation session, custom project report writing, IEEE-format research paper preparation, and mentorship through to final submission. These are available as separate add-on services.
Tech Stack
Backend is Python 3.10 and Django 5.x with SQLite. ML pipeline uses XGBoost, scikit-learn, pandas, numpy, and joblib. Weather data comes from the Windy Point Forecast API v2 using the GFS model. Frontend uses Bootstrap 5 dark theme with Plotly.js for charts and vanilla JavaScript for AJAX interactions. Model training is done in Jupyter with a TensorFlow/Keras LSTM comparison included in the notebook.
Frequently Asked Questions
Extra Add-Ons Available – Elevate Your Project
Add any of these professional upgrades to save time and impress your evaluators.
Project Setup
We'll install and configure the project on your PC via remote session (Google Meet, Zoom, or AnyDesk).
Source Code Explanation
1-hour live session to explain logic, flow, database design, and key features.
Want to know exactly how the setup works? Review our detailed step-by-step process before scheduling your session.
₹999
Custom Documents (College-Tailored)
- Custom Project Report: ₹1,500
- Custom Research Paper: ₹1,000
- Custom PPT: ₹800
Fully customized to match your college format, guidelines, and submission standards.
Project Modification
Need feature changes, UI updates, or new features added?
Charges vary based on complexity.
We'll review your request and provide a clear quote before starting work.