HantaTrack AI — Hantavirus Outbreak Prediction System using Machine Learning, Time-Series Forecasting and Environmental Risk Analysis
An AI-powered Hantavirus outbreak prediction system using Python, Flask, XGBoost, Prophet, SARIMA, and LSTM to forecast disease spread from climate and environmental data.
Technology Used
Python | Flask 3 | Pandas | NumPy | Scikit-learn | XGBoost | Facebook Prophet | Statsmodels SARIMA | TensorFlow | Keras LSTM | Matplotlib | Seaborn | Plotly.js | Joblib | Bootstrap 5 | Font Awesome 6 | Jupyter Notebook | Custom Dark CSS Theme | HTML5

Project Files
Overview of the Hantavirus Prediction System
HantaTrack AI is a complete final year project that combines epidemiology, machine learning, and full-stack web development into a single end-to-end system. Hantavirus is a serious rodent-borne viral disease that causes two life-threatening syndromes — Hantavirus Pulmonary Syndrome (HPS) across the Americas and Hemorrhagic Fever with Renal Syndrome (HFRS) in Europe and Asia. Detecting outbreaks early can save lives, and that is exactly what this project sets out to do. Using more than three decades of global surveillance data from 26 countries, the system forecasts future monthly case counts and predicts how many people are likely to be affected under a given set of environmental conditions.
This project was designed specifically for students pursuing BCA, MCA, BTech in Computer Science, and BSc IT who want a domain-rich, research-flavoured final year project that goes beyond a basic CRUD application. It demonstrates real machine learning, real time-series modeling, and a real production-style web interface — making it equally suitable for a college submission, a published research paper, or a strong portfolio piece. If you are looking for something with genuine analytical depth rather than a generic management system, this is the kind of work that stands out in front of an examiner.
Why This Project Stands Out
Most academic projects stop at training a single model and showing accuracy. HantaTrack AI goes much further. It trains six different models across two distinct problems, compares them using cross-validated metrics, and then deploys the best performers behind a clean Flask web application with a dark-themed dashboard, interactive Plotly charts, and a working REST-style API. The notebook produces more than ten publication-quality plots covering missing-value analysis, seasonal decomposition, feature importance, residual diagnostics, and country-wise heatmaps — all of which can be lifted directly into your project report or research paper.
The dataset itself is unusually rich for a student project. It blends monthly trend data, country-yearly confirmed cases and fatality rates, environmental variables like NDVI and rodent abundance index, and over seven thousand clinical records covering symptoms, severity, and outcomes. This depth lets the project ask questions that genuinely matter: when will the next outbreak peak, which countries are highest risk, and how do rainfall and rodent populations drive case counts on the ground.
Key Features
- Dual prediction engine covering both time-series forecasting of monthly case counts and regression-based prediction of affected population
- Six trained models including Facebook Prophet, SARIMA, LSTM, XGBoost, Random Forest, and Gradient Boosting with automatic best-model selection
- Interactive Flask web application with a dark navy and cyan theme, Plotly charts, and a responsive Bootstrap 5 layout
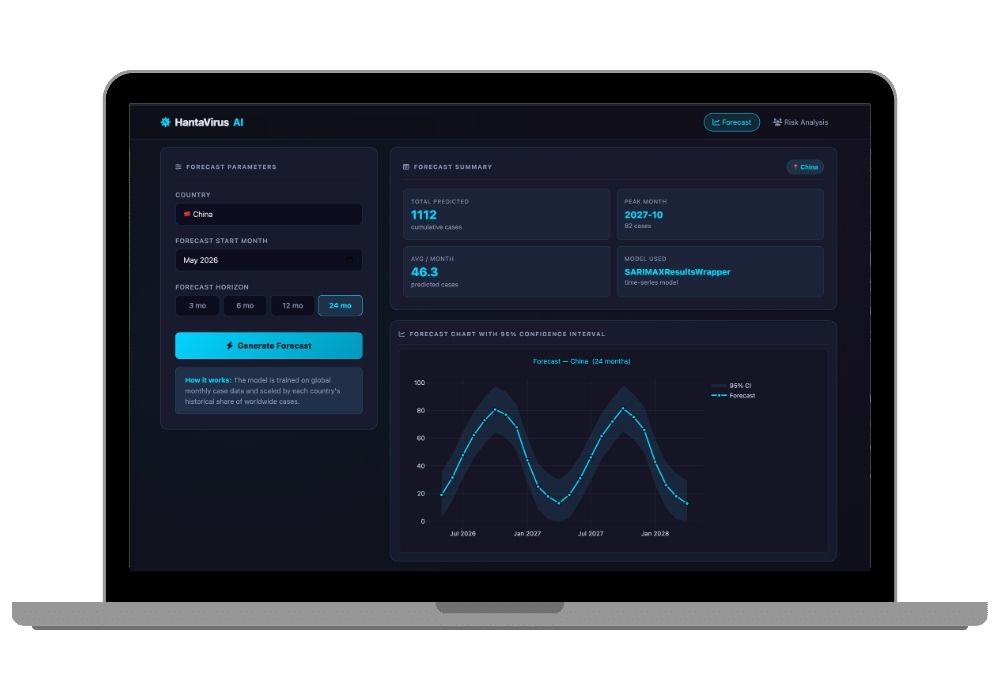
- 24-month forecast horizon with shaded 95 percent confidence interval bands and country-specific scaling for 26 countries
- Risk classification system that labels predictions as Low, Medium, High, or Critical with colour-coded badges
- 14-feature regression model using temperature, rainfall, humidity, NDVI, rodent index, deforestation, lag features, cyclical year encoding, and label-encoded categorical variables
- Full exploratory data analysis with missing value heatmaps, distribution histograms, outlier detection boxplots, and correlation matrices
- Country-wise yearly case heatmap for the top 15 affected countries plus a top-10 high-risk countries bar chart
- JSON health check endpoint at /health that reports model availability and readiness
- CSV export of forecast results directly from the web interface
- Feature importance dashboard showing the top contributors to each prediction in real time
- Saved model artifacts using joblib so models train once and serve forever
Real-World Applications
Although built as an academic project, HantaTrack AI has practical relevance across several domains. Public health departments can use this kind of forecasting to allocate surveillance resources to high-risk regions ahead of seasonal peaks. Rural healthcare planners can prepare hospitals and clinics in agricultural zones where rodent exposure is common. Researchers can use the same modeling pipeline as a template for forecasting other zoonotic diseases such as Leptospirosis, Lassa fever, or Plague. Insurance and reinsurance teams use very similar regression structures to price epidemic risk for travel and health policies. And from an educational standpoint, this project is an excellent teaching example for any course covering applied machine learning, time-series analysis, or public health informatics.
The combination of environmental data and case counts also makes this project a natural fit for climate-health research, where shifts in rainfall and temperature are being linked to changing patterns of vector-borne and rodent-borne diseases. If you plan to publish a research paper from your final year work, this domain offers a lot of room for original contribution.
Technology Stack at a Glance
The system is built entirely in Python, which keeps the learning curve approachable for students who already know the language. Pandas and NumPy handle data wrangling. Matplotlib and Seaborn produce the static EDA plots in the notebook. Facebook Prophet and Statsmodels SARIMA handle the time-series side, while TensorFlow Keras provides the LSTM model for sequence learning. Scikit-learn and XGBoost cover the regression task. Joblib serializes the trained models. On the web side, Flask 3 serves the application, Plotly.js renders the interactive charts in the browser, and a custom dark CSS theme with Bootstrap 5 gives the UI a modern, professional appearance.
Who Should Buy This Project
This project is a strong fit for final year students who want a machine learning project that is genuinely impressive but still manageable to set up and explain. It works equally well for BCA and MCA students who need a data science angle, BTech CSE students who want to show full-stack capability alongside ML, and BSc IT students who need a project with clear research value. It is also a good base if you plan to extend the work into a published paper — the dataset and methodology are documented well enough to support a proper academic write-up.
If you need help getting it running, our team offers complete project setup assistance over Google Meet, where we walk you through installation, dependencies, and a line-by-line explanation of the code. We also offer custom project development if you want to extend this system to a different disease or add new features for your specific submission requirements. You can explore more Python and AI final year projects on our marketplace to find the one that fits your syllabus best.
What You Receive on Purchase
- Complete source code for the Jupyter notebook and the Flask web application
- All six dataset CSV files covering monthly trends, environmental variables, clinical records, and outbreak history
- Pre-trained model artifacts so you can run the web app immediately without retraining
- Pre-built final year project report in college-acceptable format
- All ten plus generated EDA and evaluation plots as high-resolution PNG files
- Installation guide and requirements.txt for both the notebook and the web app
- Architecture diagram of the system flow
Final Thoughts
HantaTrack AI gives you a final year project that does not look like a final year project. It is technically deep, visually polished, and grounded in real epidemiological data — the kind of work that examiners remember. Whether you submit it as-is, extend it for a research paper, or use it as the centerpiece of your portfolio when applying for data science roles, this project gives you something genuinely substantive to talk about.
Extra Add-Ons Available – Elevate Your Project
Add any of these professional upgrades to save time and impress your evaluators.
Project Setup
We'll install and configure the project on your PC via remote session (Google Meet, Zoom, or AnyDesk).
Source Code Explanation
1-hour live session to explain logic, flow, database design, and key features.
Want to know exactly how the setup works? Review our detailed step-by-step process before scheduling your session.
₹999
Custom Documents (College-Tailored)
- Custom Project Report: ₹1,500
- Custom Research Paper: ₹1,000
- Custom PPT: ₹800
Fully customized to match your college format, guidelines, and submission standards.
Project Modification
Need feature changes, UI updates, or new features added?
Charges vary based on complexity.
We'll review your request and provide a clear quote before starting work.