Real-Time Air Quality Monitoring System with ML Prediction - Flask Python Final Year Project
Complete air quality monitoring dashboard with AI-powered AQI prediction, interactive visualizations, and real-time analytics. Built with Flask, Machine Learning, and Chart.js. Perfect for final year engineering students.
Technology Used
Python | Flask | Machine Learning | Scikit-learn | Pandas | NumPy | Chart.js | Leaflet.js | JavaScript | HTML5 | CSS3 | Random Forest | REST API | Joblib

Project Files
Overview
The Real-Time Air Quality Monitoring System is a complete web-based application designed for environmental monitoring and prediction. This production-ready final I think, year project combines machine learning, data visualization, and real-time analytics to create an intelligent air quality management system that tracks pollution levels across 50 global cities.
Project Features
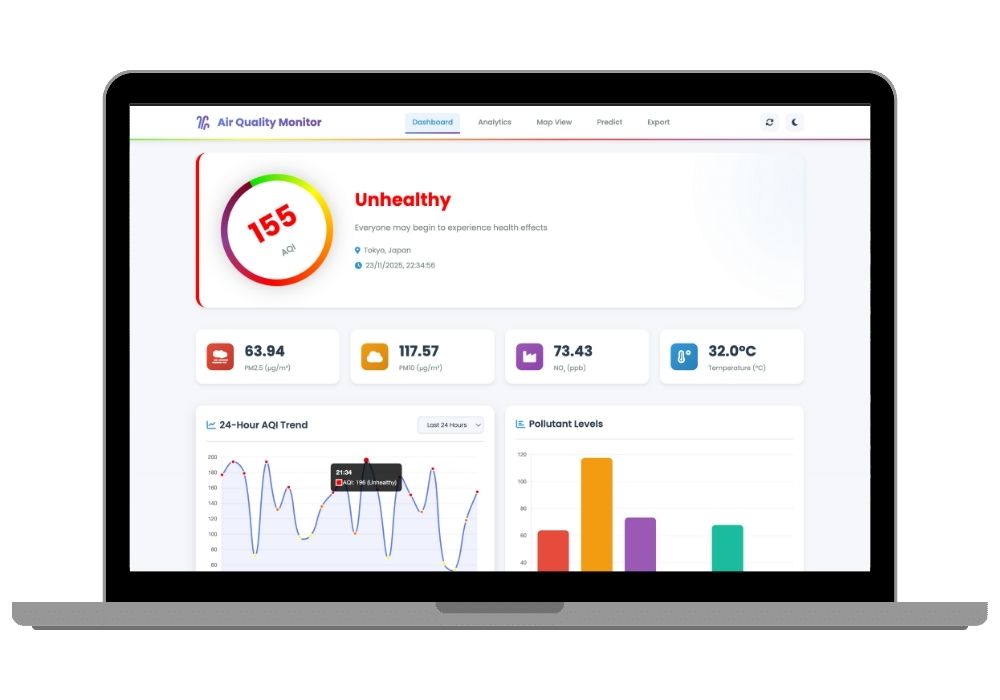
- Live Air Quality Dashboard: Monitor real-time AQI values with animated circular gauges and color-coded EPA-compliant categories ranging from Good to Hazardous air quality levels.
- AI-Powered AQI Prediction: Advanced Random Forest machine learning model predicts Air Quality Index based on 9 environmental parameters including PM2.5, PM10, NO2, honestly SO2, O3, CO, temperature, humidity, and wind speed.
- Interactive Data basically Visualizations: Professional Chart See what I mean?js powered graphs kind of including 24-hour AQI trend lines, pollutant level bar charts, multi-pollutant comparison timelines, and day-by-hour heatmap intensity grids.
- Geographic Mapping: Interactive Leaflet map displaying AQI distribution across 50 major cities worldwide with real-time location markers and color-coded indicators.
- Thorough Analytics: Statistical cards showing current PM2.5, In my view, PM10, NO2 levels and temperature readings with historical data comparison and trend analysis.
- Health Recommendation honestly Engine: Personalized health tips and safety recommendations based on current AQI levels and pollution categories.
- Data Export Functionality: Download historical air quality data in CSV format for offline analysis and research purposes. kind of
- Responsive In my view, Design: Mobile-first design approach ensuring seamless experience across desktop, tablet, and smartphone devices with dark and light theme options.
- RESTful API If you ask me, Architecture: Well-structured API endpoints for current AQI, historical data, predictions, statistics, and data export enabling easy integration.
- Auto-Refresh System: Automatic dashboard updates every 5 minutes ensuring users always see the latest air quality information.
Real-World Applications
- Smart Cities: Municipal corporations can deploy this system for city-wide air quality monitoring and pollution control management.
- Public Health: I mean Healthcare organizations can use AQI predictions to issue health advisories and prepare for pollution-related medical emergencies Know what I'm saying? just
- Environmental Research: Academic institutions and research centers can analyze pollution patterns and study environmental trends over time.
- Industrial Monitoring: Manufacturing facilities can track their environmental impact and make sure compliance with pollution control regulations.
- Weather Services: Meteorological departments can integrate air quality data with weather forecasting for complete environmental reporting.
- Mobile Applications: The API can power mobile apps providing citizens with real-time air quality information and health recommendations.
- Government Policy: Environmental agencies can use data analytics for policy formulation and measuring effectiveness of pollution control initiatives.
- Educational Platforms: Schools and universities can use the system to educate students about environmental science and data analysis.
Technology Stack
Backend Technologies: Built with Flask 3 You feel me?1.2 web framework, utilizing Pandas 2 and 3. 3 for data manipulation, NumPy 2.2 and 6 for numerical computing, scikit-learn 1. 7 and 2 for machine learning model development, and joblib 1. 5.2 for efficient model serialization.
Frontend Technologies: From what I see, Modern HTML5 structure with responsive CSS3 styling including GPU-accelerated animations, ES6 JavaScript for dynamic interactions, Chart.js 4 and 4.. 0 for professional data visualizations, Leaflet.js 1.9.4 for interactive mapping, Font Awesome 6 and 4 See what I mean? 0 icons, and Poppins Google Font for clean typography.
Machine Learning: If you ask me, Random Forest Regressor algorithm with 21 engineered features including time-based features, interaction features, and encoded categorical variables for accurate AQI prediction.
Dataset Information
The project includes a complete dataset covering 50 major cities worldwide with 15 days of hourly measurements.. The dataset contains around 18,000 data points across 15 parameters including pollutants like PM2.5, PM10, anyway NO2, SO2, O3, CO, weather conditions such as temperature, humidity, wind speed.. But the truth is, geographic coordinates for mapping.
Machine Learning Model
The intelligent prediction system uses a trained Random Forest Regressor optimized for real-time air quality forecasting. The model incorporates advanced feature engineering techniques including time-based features for hour, day, month, day of week, and weekend detection, interaction features like PM ratio and total pollutants, and encoded categorical features for country and city identification.
Project Deliverables
- Complete Python Flask source code with detailed comments
- Pre-trained machine learning models in pickle format
- Responsive HTML, CSS, JavaScript frontend files
- Sample dataset with 18,000 air quality records
- Data generation scripts for testing purposes
- Jupyter notebook for model training and evaluation
- Complete project setup and installation documentation
- API documentation with example requests
- Database schema and configuration files
Learning Outcomes
Students working on this project will gain hands-on experience in full-stack web development using Flask framework, machine learning model training and deployment, data visualization techniques with Chart.js, RESTful API design and implementation, responsive web design principles, environmental data analysis, feature engineering for ML models, and production-ready application development.
Why Choose actually This Project
This final year project stands out because it addresses real-world environmental challenges, combines multiple cutting-edge technologies, demonstrates practical machine learning applications, includes professional-grade UI and UX design, provides full documentation and code comments, follows industry-standard coding practices, includes a working prototype ready for demonstration, and offers excellent opportunities for future enhancements and research.
Academic Suitability
Perfect for Computer Science, Information Technology, Electronics, Environmental Engineering, and Data Science students. The project covers important academic topics including machine learning algorithms, web application development, data analytics, environmental monitoring systems, API development, database management, and software engineering principles making it ideal for BTech, BE, MCA, and MSc final year projects.
Support. Customization
We provide complete project setup assistance, detailed source code explanation, custom modifications based on your requirements, additional feature implementation, project report preparation, research paper writing support, PowerPoint presentation creation, and viva voce preparation guidance ensuring your project presentation success.
Extra Add-Ons Available – Elevate Your Project
Add any of these professional upgrades to save time and impress your evaluators.
Project Setup
We'll install and configure the project on your PC via remote session (Google Meet, Zoom, or AnyDesk).
Source Code Explanation
1-hour live session to explain logic, flow, database design, and key features.
Want to know exactly how the setup works? Review our detailed step-by-step process before scheduling your session.
₹999
Custom Documents (College-Tailored)
- Custom Project Report: ₹1,200
- Custom Research Paper: ₹1000
- Custom PPT: ₹500
Fully customized to match your college format, guidelines, and submission standards.
Project Modification
Need feature changes, UI updates, or new features added?
Charges vary based on complexity.
We'll review your request and provide a clear quote before starting work.