AirPulse - AI Air Quality Prediction System with Live Dashboard and Next-Day AQI Forecasting for Indian Cities
AirPulse is a Python Flask web application that predicts next-day Air Quality Index for 20 Indian cities using an XGBoost model trained on 6 years of CPCB pollution data, with a real-time glassmorphism dashboard powered by the WAQI API.
Technology Used
Python 3.10.11 | Flask 3.x | XGBoost 3.1.1 | scikit-learn 1.6.1 | pandas | NumPy | joblib | WAQI API | Jupyter Notebook | matplotlib | seaborn | Vanilla JavaScript (ES2020) | Custom CSS | Google Fonts

Project Files
AirPulse - Predict Tomorrow's Air Quality for Any Indian City
Air pollution in India accounts for over a million deaths annually, and most of us only check AQI after we have already stepped outside. AirPulse was built to change that. This is a complete, working AI and machine learning final year project that takes real pollutant readings from city sensors and runs them through a trained XGBoost regression model to predict what the AQI will be tomorrow. You get the prediction before the day even starts, along with health recommendations tailored to the forecasted air quality category.
The project has two operating modes. In Live Dashboard mode, it connects to the World Air Quality Index (WAQI) API, pulls current PM2.5, PM10, CO, SO2, NO2, and O3 readings for any selected Indian city, and feeds that data through the ML pipeline. In Manual Prediction mode, you can type in your own pollutant values from lab data or personal sensors and get a forecast without needing an internet connection at all. Both modes return a predicted AQI value, a color-coded health category, and a set of actionable recommendations.
What Makes This Project Different
Most AQI projects you will find online stop at training a model in a Jupyter notebook and printing accuracy numbers. AirPulse goes much further. It wraps the entire ML pipeline inside a Flask REST API, builds a real frontend dashboard that people can actually use, handles missing data gracefully through city-level median imputation, and falls back to a heuristic estimate if the model files are missing. This is the kind of end-to-end implementation that evaluators and interviewers notice.
The machine learning model was trained on 24,824 cleaned daily records from the Central Pollution Control Board (CPCB) dataset. This dataset covers 29 Indian cities between January 2015 and July 2020, with daily averaged readings for 12 pollutants. The target variable is next-day AQI, created by shifting the AQI column by one day within each city group to prevent data leakage across city boundaries.
Project Features
Machine Learning Pipeline: The model uses XGBoost with 500 gradient-boosted trees, max depth of 6, learning rate of 0.05, and L1/L2 regularization. It takes 14 input features including PM2.5, PM10, NO, NO2, NOx, NH3, CO, SO2, O3, Benzene, Toluene, Xylene, Month, and DayOfWeek. Data is scaled using StandardScaler fitted only on training data to prevent leakage, and missing pollutant values are filled using city-specific median imputation.
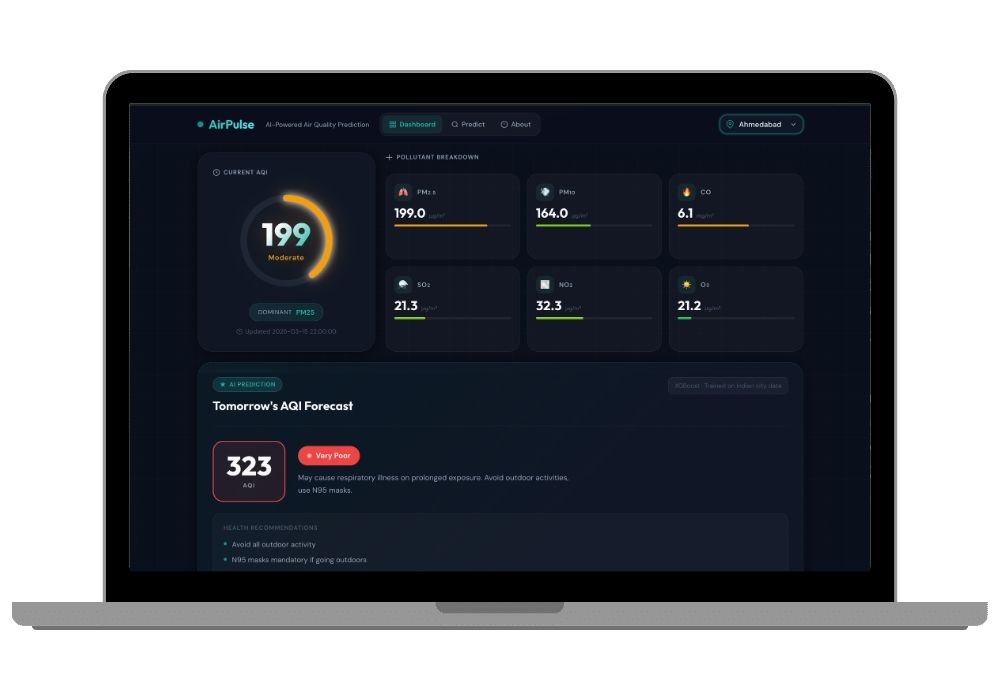
Live City Dashboard: The main page shows an animated SVG gauge that fills up to the current AQI value and glows in the corresponding health category color. Below that, six glass-morphism cards break down individual pollutant concentrations with animated level bars. A separate forecast card shows the predicted next-day AQI with a category badge and health recommendations. A color-banded AQI scale at the bottom marks both the current and predicted positions.
Manual Prediction Form: A dedicated page with synchronized slider and number inputs for all 14 features. Inputs are grouped into four sections: Particulate Matter, Nitrogen Compounds, Other Gases, and Temporal Features. Smart defaults pre-fill the month and day of week to today, and all pollutant fields start with realistic city averages. The result card animates into view on form submission with the predicted AQI, scale position, and health advice.
REST API Endpoints: Three clean API endpoints power the application. GET /api/aqi?city=CityName returns current readings plus the ML prediction. POST /api/predict accepts custom pollutant JSON and returns a forecast. GET /api/cities returns the list of 20 supported Indian cities. Every response includes AQI value, health category, color code, advice text, and specific recommendations.
Dark Glassmorphism UI: The entire frontend is built with custom CSS and zero dependencies. No Bootstrap, no Tailwind, no UI library. The design uses a deep navy base (#0A0F1C) with backdrop-filter blur cards, staggered fade-in animations driven by Intersection Observer, and GPU-accelerated transitions using only transform and opacity. Fully responsive across five breakpoints from desktop down to 420px mobile.
Complete Jupyter Notebook: A 10-cell training notebook walks through the entire pipeline from data loading and cleaning through EDA visualizations, feature engineering, model training, evaluation metrics (MAE, RMSE, R-squared, MAPE), and artifact export. It generates two publication-ready plot files: a 5-panel EDA figure and a 4-panel model evaluation figure.
Applications and Use Cases
This project works well for BCA, MCA, BTech, and MSc final year submissions in machine learning, data science, environmental computing, or IoT domains. The live API integration with WAQI makes it practical for demonstrating real-world data consumption. The manual prediction mode is useful for offline demonstrations during project vivas. The REST API architecture makes it easy to extend with a mobile frontend or integrate with Flutter or React Native apps. The EDA notebook and model evaluation plots give you ready-made content for your project report and presentation slides.
If your college requires a Python-based project with source code, this checks every box: real dataset, trained ML model, web application, API design, responsive UI, and clear documentation. The CPCB dataset is publicly available on Kaggle, so you can cite it properly in your research paper without any licensing concerns.
Dataset Details
The training data comes from the Air Quality Data in India dataset on Kaggle, originally collected by the Central Pollution Control Board. The primary file (city_day.csv) contains 29,531 raw records that get cleaned down to 24,824 after dropping rows with missing AQI values. Each row has daily averaged readings for PM2.5, PM10, NO, NO2, NOx, NH3, CO, SO2, O3, Benzene, Toluene, and Xylene. Missing values range from 17% (SO2) to 61% (Xylene) and are handled through a two-step imputation: city-level median first, then global median as a fallback.
Model Architecture and Training
The XGBoost regressor runs with these hyperparameters: 500 estimators, max depth 6, learning rate 0.05, subsample 0.8, colsample_bytree 0.8, reg_alpha 0.1, and reg_lambda 1.0. Training uses an 80/20 random split with seed 42. Feature importance analysis shows PM2.5 as the strongest predictor of next-day AQI, followed by PM10, CO, NO2, and O3. Seasonal patterns through the Month feature also carry weight, since Indian cities see sharp AQI spikes during winter months.
AQI Health Categories
The prediction output maps to seven standard categories used by the Indian government: Good (0-50), Satisfactory (51-100), Moderate (101-200), Poor (201-300), Very Poor (301-400), Severe (401-500), and Hazardous (500+). Each category comes with a specific color code, health impact description, and set of recommendations ranging from minor precautions to emergency measures.
What You Get
The complete source code includes the Flask application (app.py), Jupyter training notebook (AQI_Prediction.ipynb), three pre-trained model artifacts (.pkl files), the CPCB dataset, HTML templates for all three pages, custom CSS (~1,600 lines), JavaScript for dashboard animations and form handling, and a requirements.txt with all seven Python dependencies. Everything runs with a single command after installing requirements. If you need help setting it up on your machine, you can use the project setup service where we walk you through the entire installation and explain the source code.
Technology Stack
Backend: Python 3.10+, Flask 3.x, XGBoost 3.1.1, scikit-learn 1.6.1, pandas 2.3.3, NumPy 2.2.6, joblib. Frontend: Vanilla JavaScript (ES2020), Custom CSS with glassmorphism design, Google Fonts (Outfit + DM Sans). External: WAQI API for real-time pollutant data. Notebook: Jupyter, matplotlib, seaborn for EDA and evaluation plots.
Addon Services Available
Need more than just the source code? We also offer custom project report writing in your college format, research paper drafting and publishing guidance, and presentation slides tailored to your submission requirements. If you want a similar project with different features or a different domain, our idea implementation service can build it from scratch based on your requirements.
Extra Add-Ons Available – Elevate Your Project
Add any of these professional upgrades to save time and impress your evaluators.
Project Setup
We'll install and configure the project on your PC via remote session (Google Meet, Zoom, or AnyDesk).
Source Code Explanation
1-hour live session to explain logic, flow, database design, and key features.
Want to know exactly how the setup works? Review our detailed step-by-step process before scheduling your session.
₹999
Custom Documents (College-Tailored)
- Custom Project Report: ₹1,200
- Custom Research Paper: ₹1000
- Custom PPT: ₹500
Fully customized to match your college format, guidelines, and submission standards.
Project Modification
Need feature changes, UI updates, or new features added?
Charges vary based on complexity.
We'll review your request and provide a clear quote before starting work.